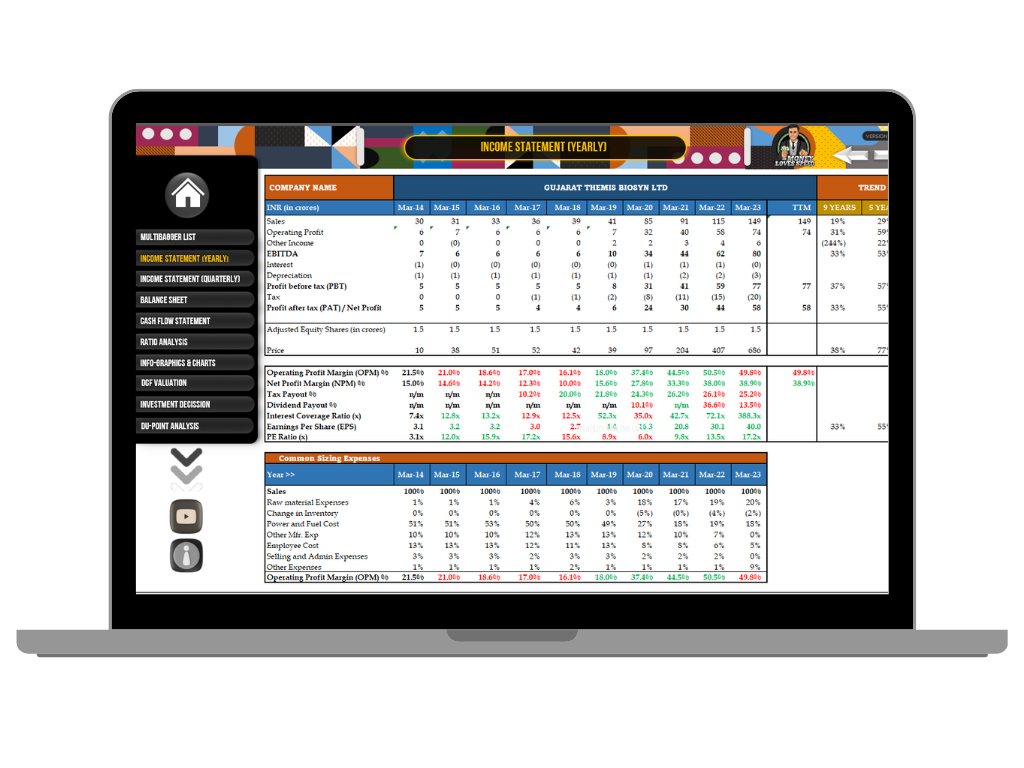
In the dynamic and ever-evolving world of finance, comprehending a company’s financial health is paramount for investors, analysts, and financial enthusiasts alike. At the core of this understanding lies the income statement, a pivotal financial document that unveils the intricate narrative of a company’s performance. Whether you’re a seasoned investment guru or just embarking on your journey into financial literacy, mastering the art of deciphering income statements can be a game-changer.
In this comprehensive guide, we embark on an enlightening journey to demystify the complexities of income statements. We’ll explore the key components that make up this crucial financial document, decode the intricacies of financial jargon, and equip you with the knowledge to extract valuable insights from the numbers.
In this article, we explore reading income statements from a “Multibagger Stock Selection Process” perspective. An income statement, or profit and loss statement (P&L), summarizes a company’s revenue, expenses, and net income over a specific period. As one of the three key financial statements, alongside the balance sheet and cash flow statement, it follows the accrual basis of accounting, recognizing revenue and expenses when earned or incurred, respectively, regardless of cash flow timing.

"Manage The Top Line And The Bottom Line Will Follow" - Steve Jobs
When it comes to selecting multibagger stocks, which are stocks that have the potential to increase in value by several times over their original price, it’s crucial to adhere to the principle of “Manage the Top Line and the Bottom Line Will Follow.” This principle emphasizes the importance of prioritizing a company’s revenue growth and profitability, as these factors ultimately drive long-term stock price appreciation.

Focusing on Top-Line Growth:
Top-line growth refers to the increase in a company’s revenue over time. It indicates that the company is expanding its market share, attracting new customers, and generating more sales. When a company consistently exhibits top-line growth, it demonstrates its ability to execute its business plan and capture market opportunities.
5 Years Average Revenue growth must be 10%
Ensuring Bottom-Line Profitability:
While top-line growth is essential, it’s equally important to ensure that the company is generating healthy profits. Bottom-line profitability refers to the company’s net income, which is calculated by subtracting expenses from revenue. A company that consistently reports strong bottom-line profitability demonstrates its ability to manage its costs effectively and convert revenue into earnings.
5 Years Average Net Profit growth must be 12%
Importance of Quality and Consistency
As an analyst, you can assess the quality and consistency of income statement numbers by examining quarterly income statements and annual reports. Here are some key indicators to consider:
1. Revenue:
Revenue, also known as sales, is the total amount of money that a company earns from selling its products or services over a specific period. It is the top line of the income statement and represents the gross income generated by the company’s business activities. Revenue is a crucial metric for assessing a company’s financial health and performance. It indicates the company’s ability to generate sales and attract customers. A company with consistently increasing revenue is generally considered to be a healthy and growing business
2. Operating Margin
Operating margin is a crucial profitability metric that measures a company’s efficiency in converting revenue into profit from its core operations. It is calculated by dividing operating income by revenue and expressed as a percentage. A higher operating margin indicates that the company is generating more profit from each dollar of revenue it earns
3. Other Income
Other income, also known as non-operating income, is the income that a company generates from sources other than its core business operations. If a company’s other income is increasing in a particular year, then analyst must find the explanation behind it.
4. EBITDA
EBITDA, which stands for Earnings Before Interest, Taxes, Depreciation, and Amortization, is a financial measure that reflects a company’s operating profitability. It is calculated by adding back interest expense, taxes, depreciation, and amortization to a company’s net income. This metric is often used by investors and analysts to evaluate a company’s financial performance and make comparisons with cash from operating activity.
5. Interest
An interest rate is the amount of interest paid on a loan or deposit over a specific period, typically expressed as a percentage of the principal amount. Understanding interest rates is essential for making informed financial decisions. By knowing how interest rates affect borrowing costs, savings returns, and investment returns, the analyst can make better choices in evaluating a company.
6. Depreciation
Depreciation is the accounting method of allocating the cost of an asset over its useful life. It is a non-cash expense that is recorded on the income statement to reduce the book value of an asset over time. Depreciation is a fundamental concept in accounting that plays a crucial role in measuring a company’s profitability and financial health. It allows companies to match expenses to revenue, allocate asset costs over time, and calculate the accurate value of their assets. Understanding depreciation is essential for interpreting a company’s financial statements and making informed investment decisions.
7. Profit before tax (PBT)
Overall, PBT is a widely used and informative metric for evaluating a company’s operating profitability and making comparisons between companies. However, it should be interpreted with caution and considered alongside other financial metrics for a holistic assessment of a company’s financial health.
8. Tax
In an income statement, taxes refer to the portion of a company’s profits that is owed to the government in the form of income taxes. Taxes are a significant expense for companies, and their accurate representation in the income statement is crucial for understanding a company’s true profitability. Investors and analysts use taxes to assess a company’s financial health, make investment decisions, and evaluate its tax planning strategies.
9. Profit after tax (PAT) / Net Profit
Profit after tax (PAT) is the net income of a company after all taxes have been paid. It is the final measure of a company’s profitability and is often used as a key metric for evaluating a company’s financial performance. Net profit are important metrics for evaluating a company’s financial performance.
How to Read Income Statement With the help of AI and Chat GPT?

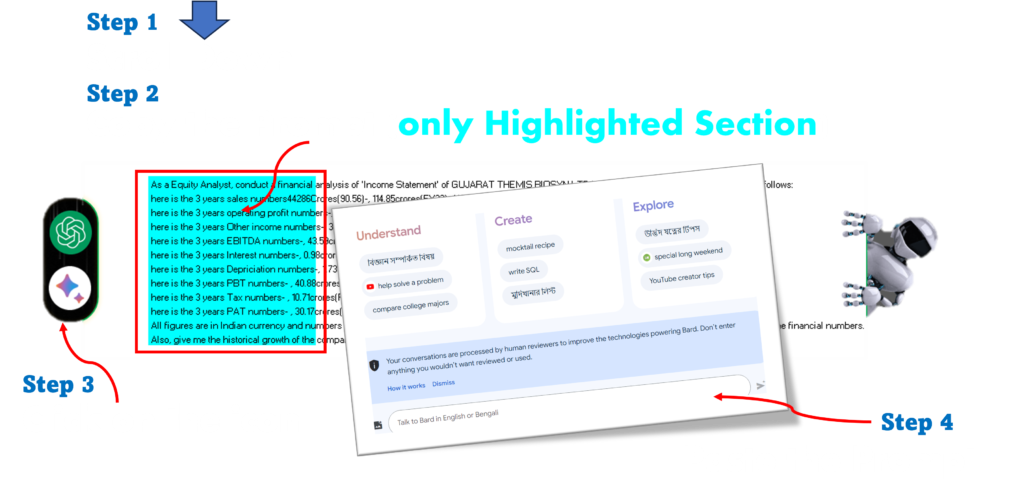
Analyzing income statements using AI and Chat GPT has become effortless with the Multibagger Stock Selection Model. Simply copy the prompt and paste it into Google Bard or Chat GPT, and you’ll receive a comprehensive analysis. This model automatically generates prompts for both yearly and quarterly income statements, eliminating the need to learn how to craft prompts yourself. Simply scroll down to your income statement and you’ll find the prompt already generated. Copy the prompt, click on either the Chat GPT or Google Bard icon, paste the prompt, and witness the magic unfold. It’s like having an equity research analyst at your fingertips, providing pin-point accurate analysis.
Disclaimer:
This blog/video is for educational purposes only and should not be considered financial advice. It is essential to conduct your own research and consult with a qualified financial advisor before making any investment decisions. Your personal financial situation, risk tolerance, and investment goals are unique, and this content may not be suitable for you. Please make informed decisions based on your specific circumstances and professional guidance.


